What are some frequently asked questions regarding the Growth Pathways Report?
The Growth Pathways Report provides customized pathways for students of varying achievement levels giving educators data to make informed decisions about instruction. Below are some questions educators are asking to assist in their understanding of the report.
Growth Pathways Report FAQs
What is a reporting/assessment period?
Reporting periods are considered numbers 0-11 that are associated with calendar months.
A period represents a scope of time. There are twelve periods in a school year. Periods are numerical in nature, and the first period will always be 0 (not 1). Periods are associated with calendar months, with period 0 being associated with the first month (or the month of the rollover date). The second would then be considered period 1, and the month after that would be period 2, etc.
So, what does that really mean? Let's say, for example, a campus has a start or rollover date in August. If a student logs in at any time in August - they will be prompted to take an assessment and that assessment will be for period 0. When the teacher runs a report for August, they are really running it for period 0. The month of September would be considered period 1, October would be period 2, and so on.
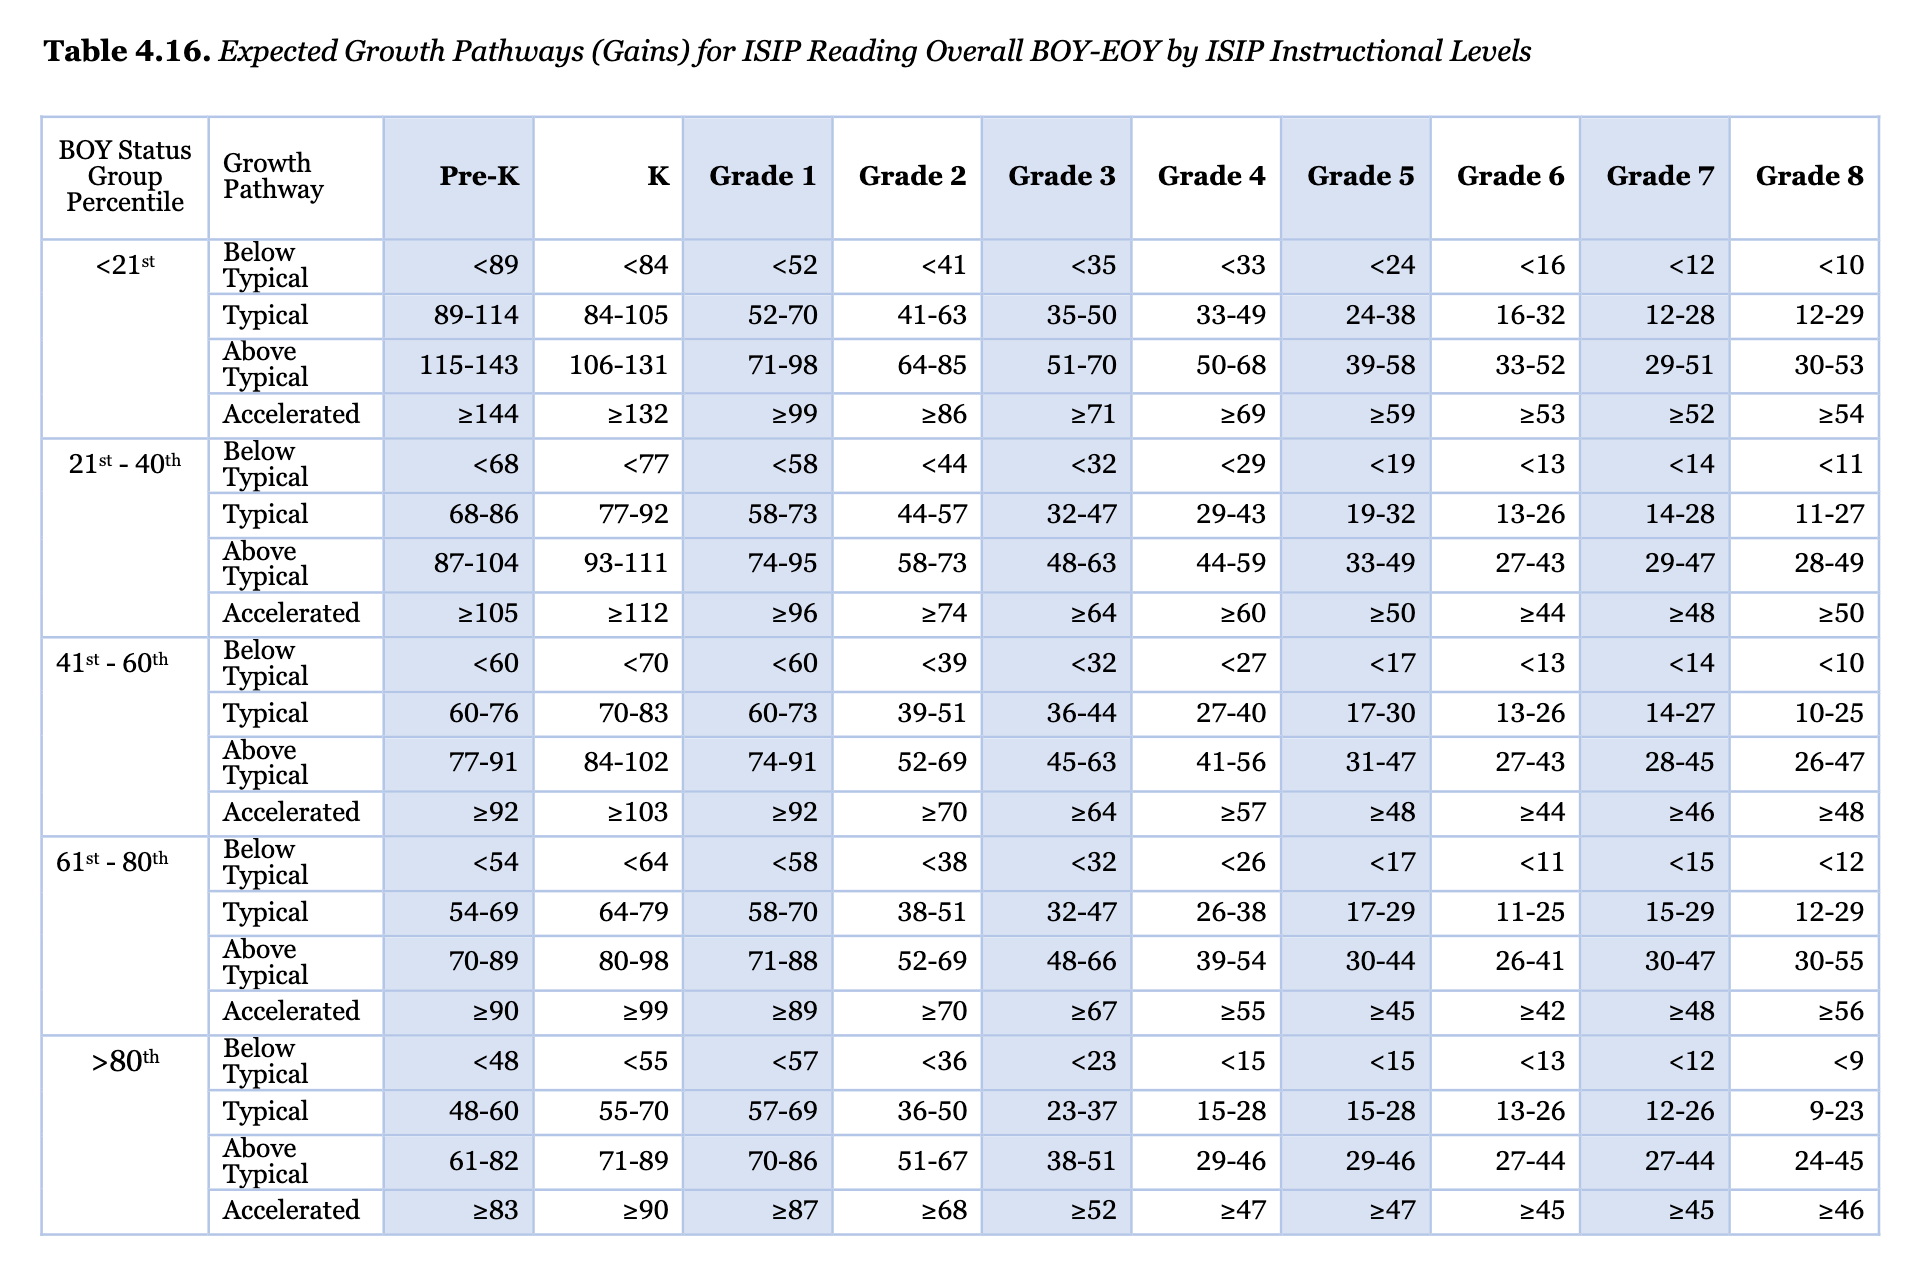
In order to build a growth pathways report from the beginning of the school year, a student must have a Period 1 overall ISIP score. This information will determine the BOY status group a student is assigned to and it will define a student's growth pathways for the entire school year based on the information in this table. 
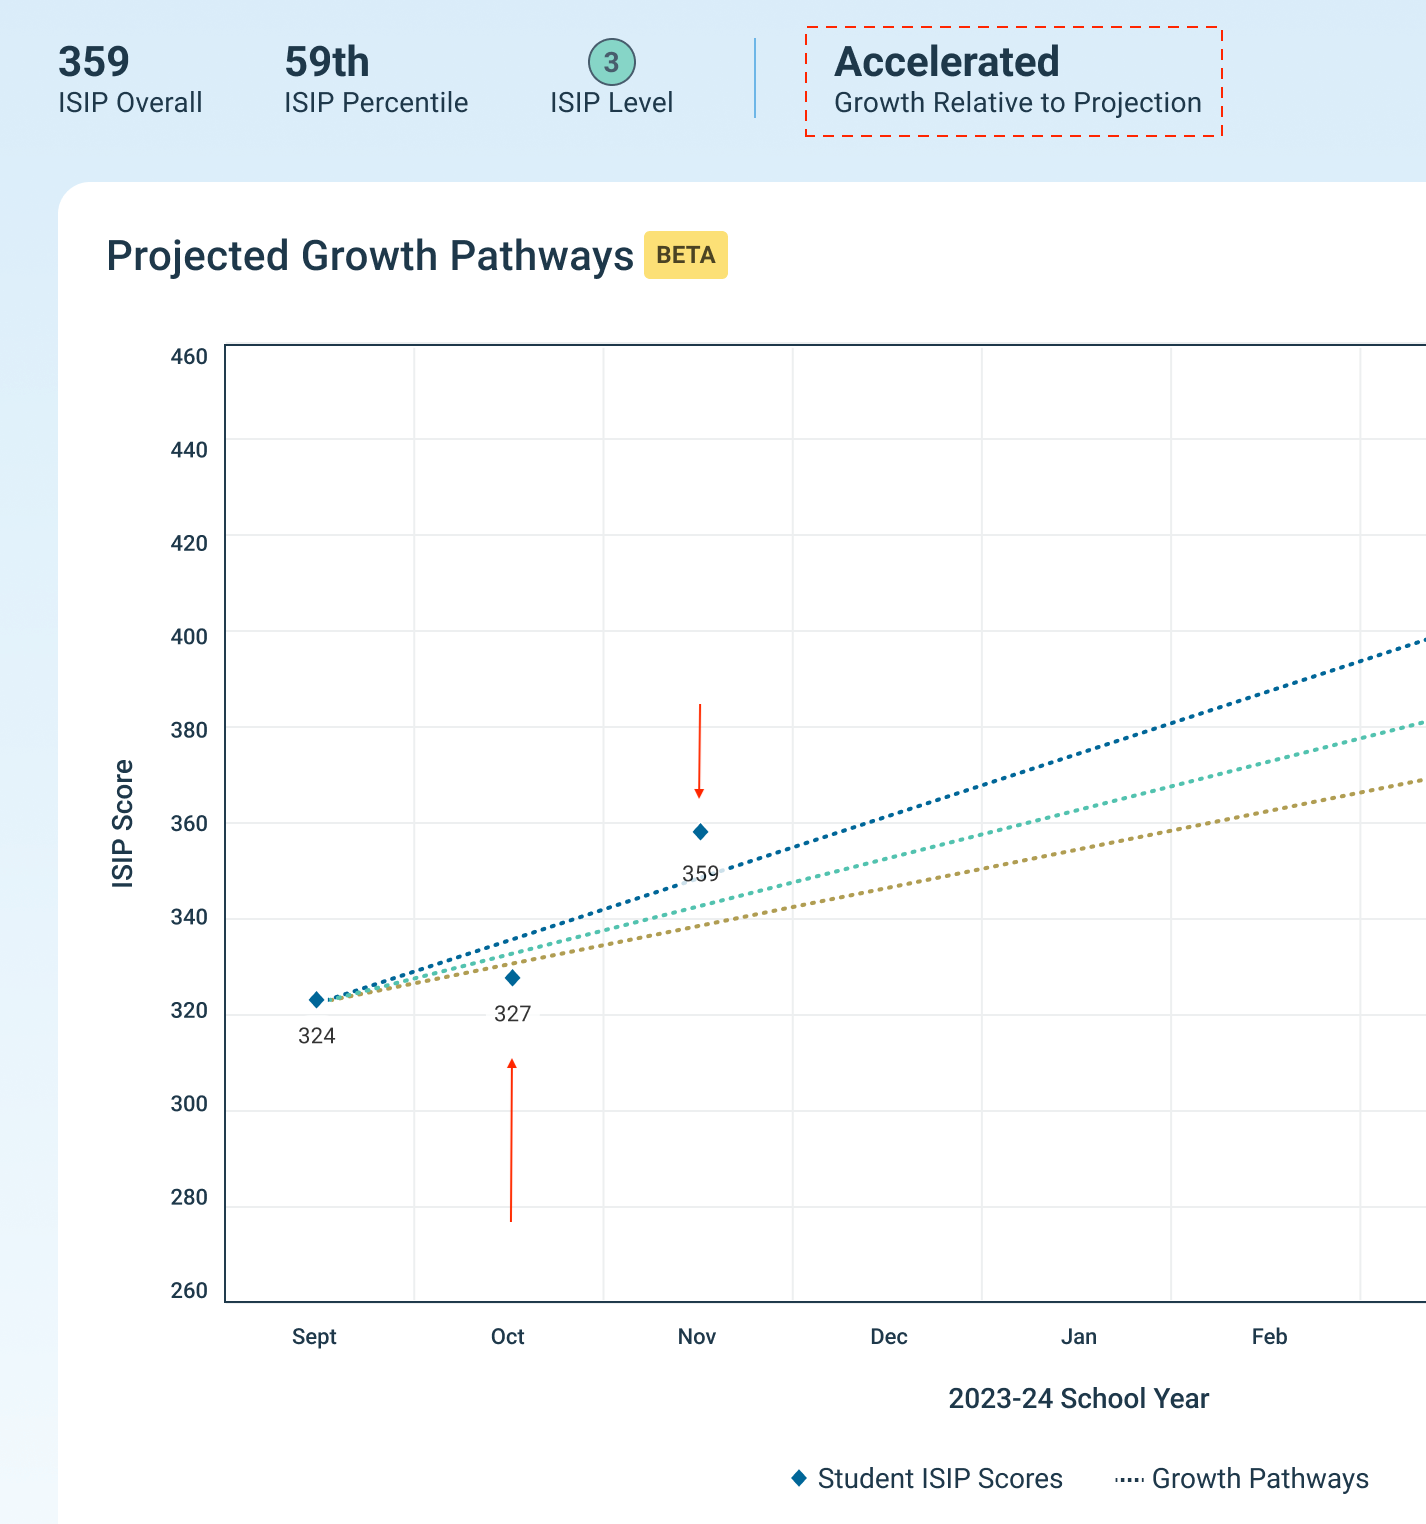
If a student has a Period 1 ISIP score, their growth pathways will display in the report and remain unchanged for the entire school year. With each subsequent ISIP score (Period 2, Period 3, etc.), the growth pathways report will update by placing a new ISIP data point above the corresponding month and by reporting the current growth relative to projection status as shown here.

Districts with Period 0 in July, Period 1 in August, and Period 2 in September…
- All students that have recorded a Period 1 and a Period 2 ISIP should have an August data point with growth pathways, a September data point, and a growth relative to projection for September.
- All students that have recorded a Period 1 ISIP only should have an August data point with growth pathways and a pending growth relative to projection.
Districts with Period 0 in August and Period 1 in September…
- All students who have recorded a Period 1 ISIP should have a September data point with growth pathways and a pending growth relative to projection.
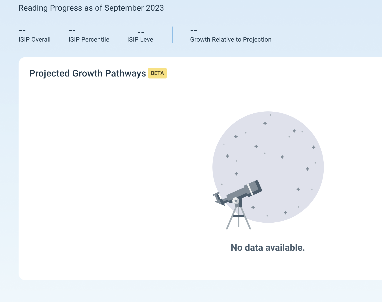
- Students who have not recorded a Period 1 ISIP should receive the empty state until they record a Period 1 ISIP.
Districts with Period 0 in September…
- All students should receive the empty state until they record a Period 1 ISIP.
Do all students have to assess in Period 1 to have data for the Growth Pathways Report?
Yes. In fact, for now, the only way to get a Growth Pathways Report is to record a Period 1 ISIP.
DeleteHow did Istation develop the Growth Pathways Report?
Istation’s Research team used a nationally representative 2018-19 normed sample of students in PreK through 8th grade to analyze students’ actual growth on their overall ISIP reading scores across the school year. At each grade level, students were placed into five beginning-of-year achievement groups linked to Istation’s instructional levels, which are set to identify students at risk for developing reading deficits. Each instructional level corresponds to 20 percentile points on a normal bell curve, with the lowest level - level 1 - representing achievement from the 1st to 20th percentiles and the highest level - level 5 - representing achievement from the 81st to 99th percentiles. The Research team then calculated a gain score for every student in each of the five instructional levels within a grade by subtracting students’ beginning of year overall ISIP reading scores from their end of year overall ISIP reading scores. For example, a student who began the year with an overall ISIP score of 324 and ended the year with an overall ISIP score of 391 would have a gain score of 67. The resulting gain scores were used to create percentile gains by dividing the gain scores on a normal bell curve for each beginning of year instructional level within a grade. The Research team then assigned labels to expected growth pathways, with gain scores falling between the 41st and 60th percentiles classified as typical growth. Gain scores falling between the 1st and 40th percentiles are classified as below typical growth. Gain scores falling between the 61st and 80th percentiles are classified as above typical growth, and gain scores falling between the 81st and 99th percentiles are classified as accelerated growth.
DeleteWhat is meant by typical annual growth?
Typical annual growth represents the average growth in ISIP points from BOY to EOY for students in the same grade with the same starting achievement level.
- Below Typical Growth - Gain scores falling between the 1st and 40th percentiles
- Typical Growth - Gain scores falling between the 41st and 60th percentiles
- Above Typical Growth - Gain scores falling between the 61st and 80th percentiles
- Accelerated Growth - Gain scores falling between the 81st and 99th percentiles
How can I use the Growth Pathways Report?
Istation designed the report with five suggested uses in mind. Educators can use the report to set realistic, achievable growth goals for all students, monitor individual student progress against growth goals, identify how quickly students are growing relative to their grade level peers with similar beginning of year reading achievement, inform decisions about instruction and intervention, and evaluate the extent to which the total instructional approach is working or whether modification is needed to meet goals.
Istation’s new Growth Pathways Report will empower educators to make monthly inferences about whether students are making adequate reading progress, reflect monthly on the efficacy of instructional systems and supports in place for all students, engage in monthly problem-solving cycles to make formative adjustments to instructional systems and supports, and most importantly, pursue yearly equitable growth goals for students of all achievement levels because we provide customized pathways for students of varying instructional levels across a grade. Essentially, Istation’s Growth Pathways Report is designed to level the field for students and educators alike when it comes to setting, monitoring, and achieving growth goals.
How much growth should students show annually on this report? What is realistic?
There is no amount students "should" grow. The report describes how students "could" grow based on actual growth data from their similar academic grade level peers. "Typical growth" is a realistic growth pathway for students, as that represents average growth.
DeleteWhat is the difference between the ROI report and the Growth Pathways Report?
There are differences in the methodologies used. The ROI report shows low, medium, and high growth based on percentile growth (e.g., starting at the 25th percentile in the fall and growing to the 30th percentile in January). While it shows how a student grows in comparison to others, it does not capture growth as well at the upper end of the percentile scale. It also does not take into account the student’s grade, or ISIP level or tier.
In contrast, the growth pathways provide bands of scores per growth trajectory rather than one specific score or data point. This is because within an ISIP Level students can have scores that are at the lower, medium or upper bound. The growth pathways take into account that students at different levels grow at different rates, so it includes the student’s ability level as part of the methodology.
Why do I see a "no data available" moon on my report?
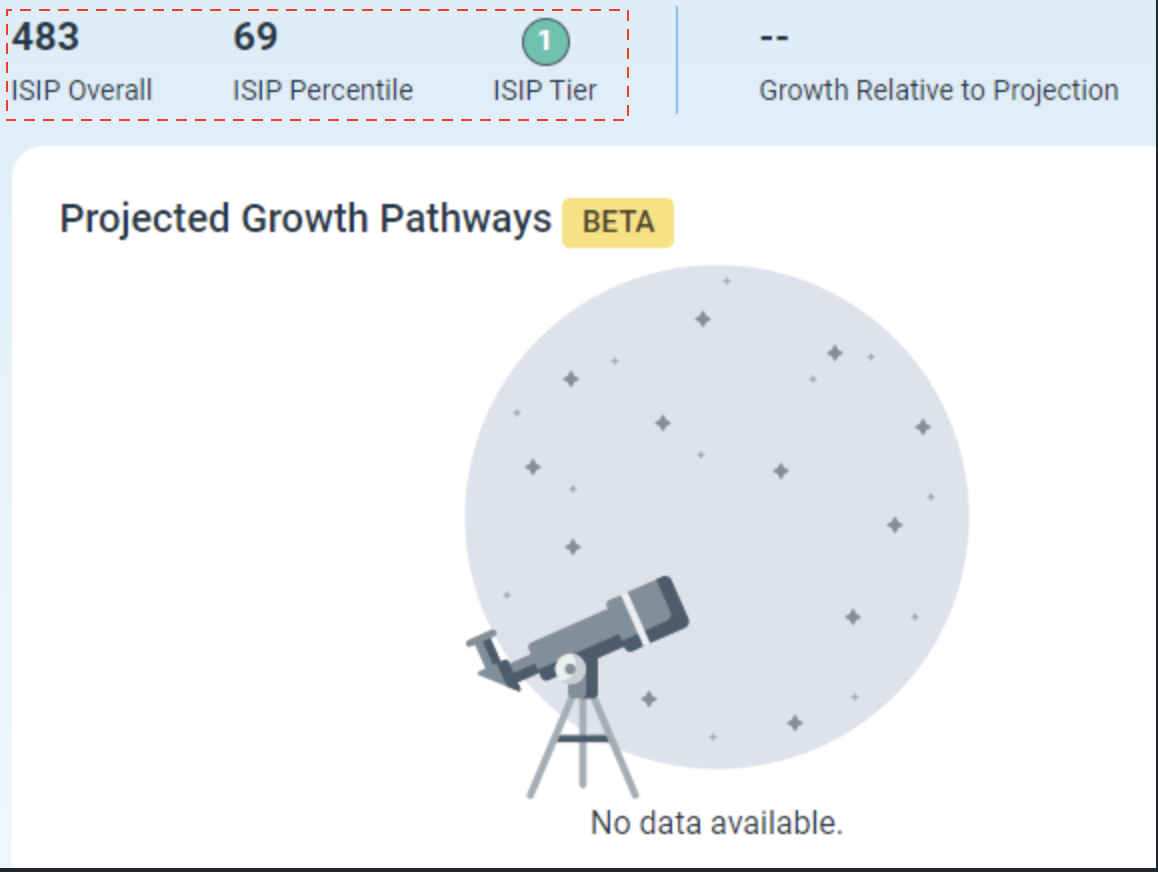
If a student does not record a Period 1 ISIP for any reason, that student’s growth pathways report will default to the “empty state” as shown here.

If a student does not record a Period 1 ISIP but does record another period’s ISIP than the data at the top of the report will reflect the student’s latest ISIP overall score, percentile, and tier/level.

Is the Growth Pathways Report available for ISIP Lectura or ISIP Math?
At this time, the Growth Report is only available for ISIP Reading. Istation expects to have it available by the Fall of 2024.
DeleteWill an On Demand Assessment (ODA) show on the Growth Pathways Report?
No. The Growth Pathways Report will use only the first attempt of each assessment period.
DeleteWhy is this a beta report? What does that mean?
This is the first version of the Growth Pathways Report and it has been through extensive internal testing and is ready for our customers to use. However, it will be enhanced in the near future as we gather feedback from our user base and respond to trends in the feedback that we will use to make the report better over time.
DeleteFind out more about How do I read the Growth Pathways Report?
If you have any questions about this information, please contact our support team at: support@istation.com or 866-883-7323, option 2.